3 Ways to Modernize Road Management with AI and Aerial Imagery
Across the United States, roads form the backbone of daily life, supporting the movement of people, vehicles, and goods. But keeping roads safe and functional is an ongoing challenge. Wear and tear from traffic, rain and snow, and time can quickly degrade roadway conditions, making regular monitoring and maintenance important. For road planners and transportation officials, including those at local, state, and federal Departments of Transportation (DoT) agencies, having access to accurate, up-to-date information is key to identifying issues and prioritizing repairs efficiently.
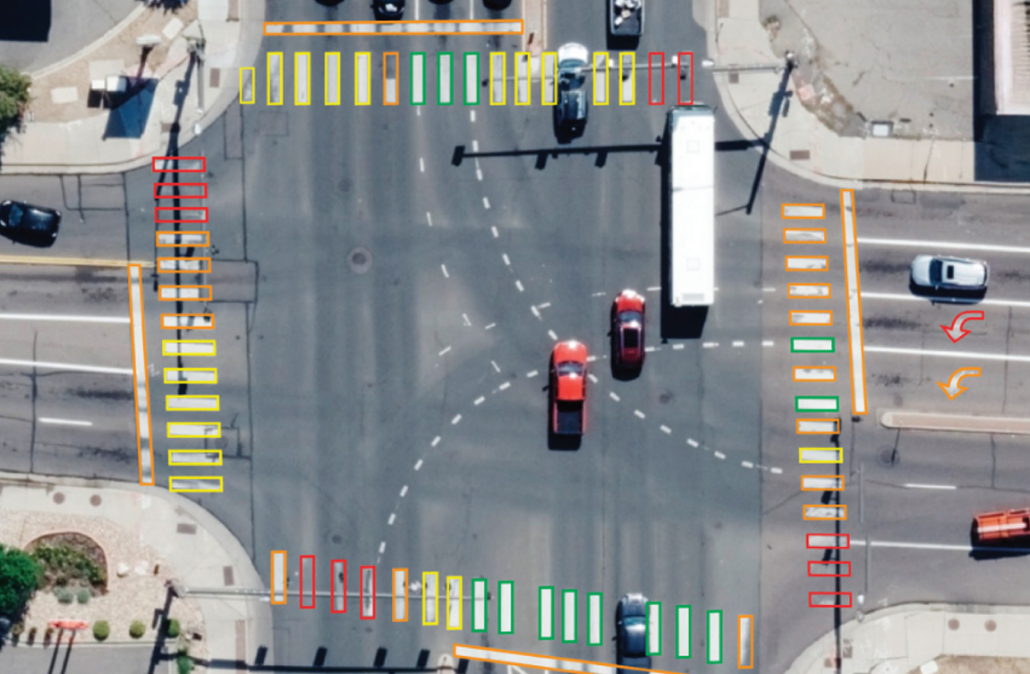
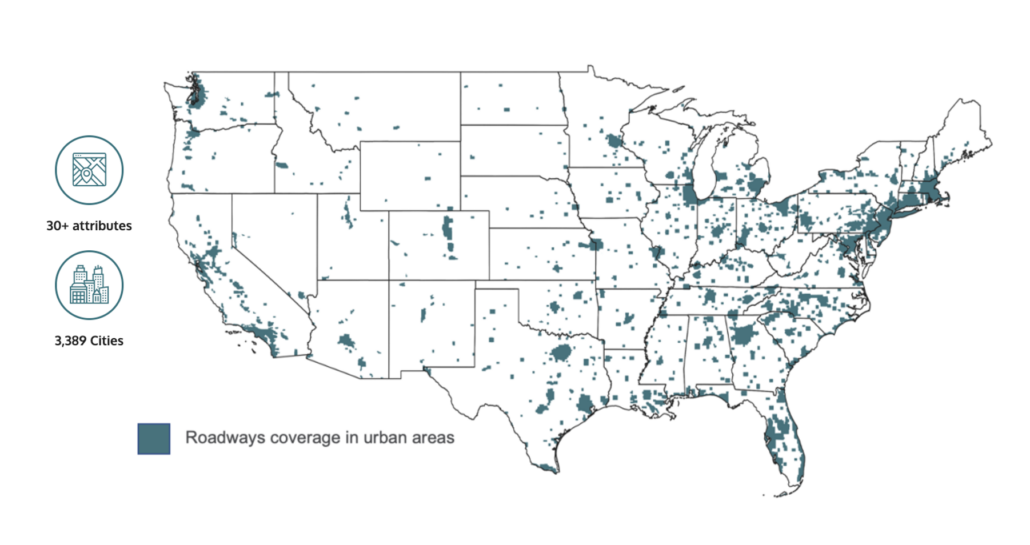
Understanding roadway conditions is especially important for protecting vulnerable road users (VRUs), such as pedestrians and bicyclists. Staying ahead of roadway maintenance starts with access to current aerial imagery and geospatial data. Vexcel’s Elements: Roadways is a roadway dataset extracted from Vexcel’s own high-resolution aerial imagery, covering more than 3,300 U.S. cities. Planners can access over 30 automated attributes focused on two key types of non-highway road data: infrastructure and pavement markings.
With infrastructure data, planners can map and inventory curb mats, pedestrian islands, and roundabouts to better understand road compliance.
With pavement markings data, they can identify and evaluate the condition of painted symbols, arrows, text, stop bars, crosswalks, and bicycle lanes.
Below are three examples of how transportation officials, engineering firms, and DoT agencies are using Vexcel’s AI-derived roadways information to evaluate the safety of roads and improve maintenance plans.
Using AI Data to Spot Road Issues at Scale
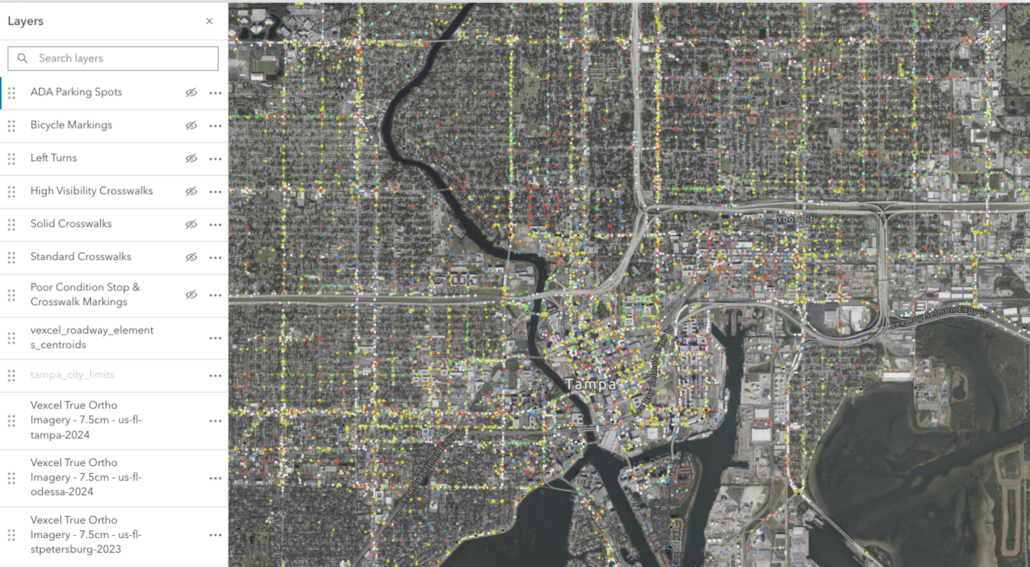
Transportation planners and engineers can use AI-derived roadway data to quickly inventory assets and identify problem areas. With a single view, they can assess city-wide hotspots using color-coded condition ratings. In the example below from Tampa, Florida, planners can easily pinpoint red zones where maintenance should take priority over yellow or green areas. They can also quantify the number of red zones to better estimate the resources required to address pavement or infrastructure concerns.
Create Heat Maps for Stop & Crosswalk Conditions
Zooming in again on Tampa, the data highlights conditions of stop lines and crosswalks, which are critical for VRU safety. Poorly maintained or faded crosswalks put pedestrians and cyclists at risk. A heat map shows the most concerning crosswalk conditions, including the type of crosswalk. As the map zooms in further, planners can clearly see lines that are faint or missing. Stop lines also show deterioration. This area can then be flagged for repainting to restore visibility and user safety.
Evaluating Left Turn Arrows
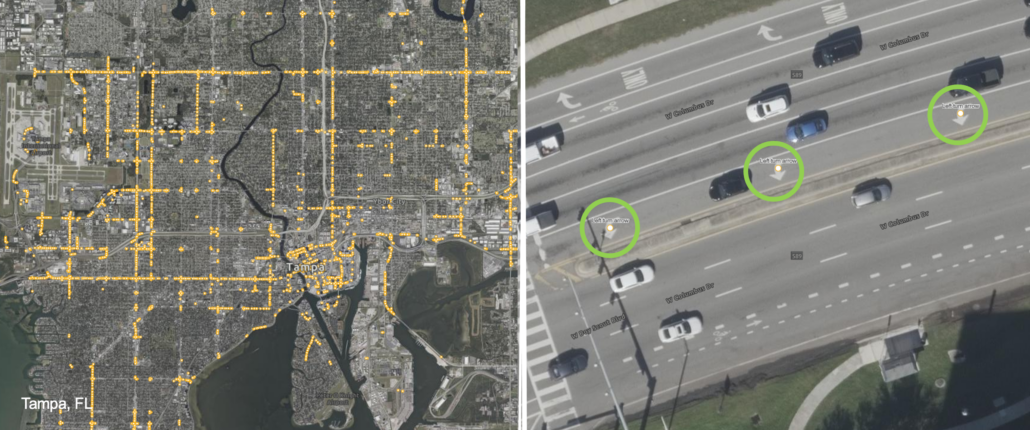
In busy areas, left turn arrows must be highly visible and faded or missing arrows pose a serious safety issue. With Elements: Roadways, planners can identify all streets with left turn arrows and generate a comprehensive map. Then, they can take a closer look at condition ratings for each arrow. Are they visible? Faded? This information helps prioritize repainting and improves overall road safety and traffic flow.
Get Access to Roadways Data in Your Area
These are just three of the many ways you can use Elements: Roadways to improve how you remotely manage and maintain roads. Contact our experts below to schedule a full demo and see what’s possible in your area.


