
A Beginner’s Experience Using Vexcel Data Inside ArcGIS Pro
Pat Edwards is the Technical Presales Manager for Vexcel Data and has a long history of working with GIS data. But he had yet to try our data inside an Esri product. Below is his experience.
I’ve worked with GIS data for over six years, but this week was my first using a desktop Esri product. I have spent a lot of time using QGIS and written thousands of lines of code in Python and JS to perform operations on geospatial data, but this week I delved into a whole new world by using Esri’s ArcGIS Pro.
This week, I was using it to deepen my understanding of Vexcel’s new Elevate product. This is a new product suite for us, and the two pillars of Digital Surface Model (DSM) and Digital Terrain Model (DTM) both drop into ArcGIS Pro without any hassle and with ease. I also performed some analyses that were quite powerful with no problems.
My preconceptions going in were:
- ArcGIS Pro has way too many features to have a simple User Experience (UX)
- I don’t need ArcGIS Pro because it does way more than I need; I’d rather use simpler, more focused tools
After a week, I have to say that the UX is impressive. To fit so much functionality into a relatively simple interface is an achievement. And while I’m not going to start using it in place of code and visualization in web frameworks day to day, I’ll use it for delving into new data sets where I want to quickly load, view and perform standard geospatial computations.
The rest of this post will focus on how I was able to generate the basis for a digital twin of a residential area and perform a line-of-sight analysis that could be useful in wireless network design.
Loading data
Both our DSM and DTM products are delivered as 256 x 256-pixel tiles in GeoTIFF format. The orthorectification process and ground control procedures meant that the GeoTIFF can be encoded with coordinates that enable ArcGIS to position the image accurately on earth. Being able to just drag and drop one or more images made it easy to get started.
The default styling that ArcGIS applies shows low elevation areas as dark, with higher elevations being light. Even with this basic style, trees and build rooftops are clearly visible. Remember, we’re not seeing in the regular sense here. The pixels are encoding height, not the wavelengths of light reflected.
Styling data
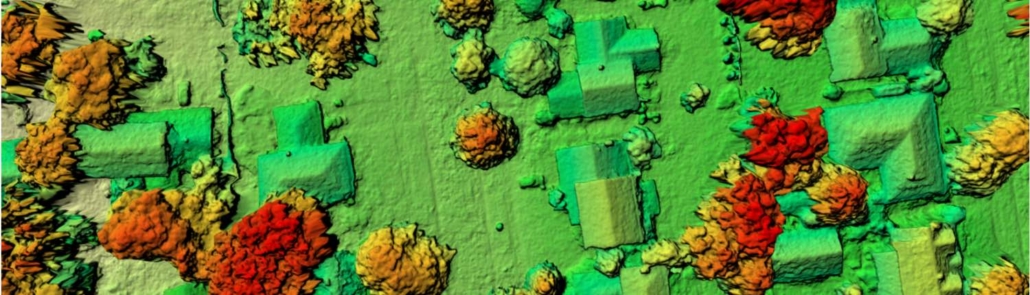
The black and white color scale is great for overlaying the output of an analysis that uses color to convey information (such as the Viewshed analysis below). However, a bathymetric color scale is a bit richer, with buildings showing up as blue and trees taking up the spectrum from green to red.
Starting on a digital twin
The process of taking the elevation model along with our oblique imagery to create a true digital twin – like that shown off during the Esri plenary this week – is a little beyond a “using Esri for the first week” post (maybe next week?). But even without adding in the oblique imagery, we can easily create a 3D model of a residential area that has all the detail needed to make line-of-sight calculations. Just drag the DSM from the 2D Layers to an Elevation Surface.
The model lacks detail on what the sides of buildings and trees look like, but as I’ll show below – that’s unnecessary for analytic 3D models such as line-of-sight or viewshed.
Exploratory 3D Analysis
Now the fun part which was so simple as to almost be anticlimactic. With as few as six clicks, I was able to load a Shapefile containing lines – such as candidate lines-of-sight from a 5G terminal to a home or a backhaul device – and then view with a green highlight the segment of the line that the observer (or transmitter) could see (or send/receive data) along. The magenta shows where the observer cannot see.
What else did I do?
I did a whole range of other analyses and did find the limits of my machine in my excitement to load more and more of this very rich data.
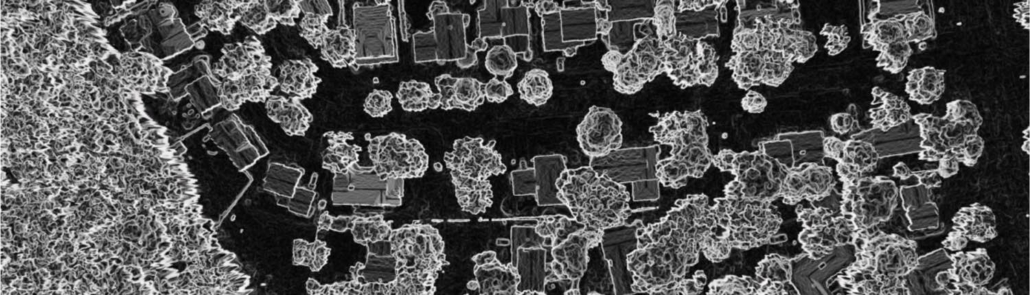
Slope angle calculations transform images into a format where the edge of a building or tree is immediately obvious. This sort of feature engineering enables AI/ML workflows to be more effective in identifying features for classification. While I would personally apply these functions in an ML pipeline using GDAL or Numpy, being able to see the output in ArcGIS and experiment with other common functions makes it easy to explore a whole range of interesting preprocessing functions.
One of my favorite images was the output of shaded relief. The ‘warmer’ the color, the more light that is hitting that surface, with darker patches being well out of the light for most of the day.
What’s next?
As far as using Esri, I’m going to keep using it to explore our imagery library. I want to see what else is possible with 3D analysis, as well as incorporate some of our NIR data to create NDVI maps. Ideally, I’d love to do a post where I can collaborate with someone who can provide something to complement our imagery and elevation data such as another data source or use case that can leverage the DSM or DTM. If you’re interested in creating this content, reach out to me at pat.edwards@vexcelgroup.com.

