Let’s get technical: Using Web Map Tiles in Python (Pt 1)
As part of ongoing education for our customers, we provide a technical blog series to help enlighten those who want to learn how to maximize their use of Vexcel imagery and data. Below is Part I in a series about using web map tiles by our guru of geospatial information, Pat Edwards.
Part I in this technical blog I’ve put together aims to introduce readers to the basics of acquiring and pre-processing imagery to run a simple unsupervised learning model on the images, before processing the output into a geospatial vector feature set.
In Part II, I’ll use the example of detecting non-specific features in urban environments with an unsupervised learning algorithm. This series is intended as a starting point for other analyses, like building and tree detection for those with more experience in computer vision and machine learning than remote sensing and GIS. I’ll also help introduce those more familiar with GIS to some simple, open source data science libraries that can be used to derive vector feature from raster data using algorithms that might not usually be included in common geospatial software.
What are map tiles?
If you’ve ever used Google or Bing Maps, you’ve used map tiles.
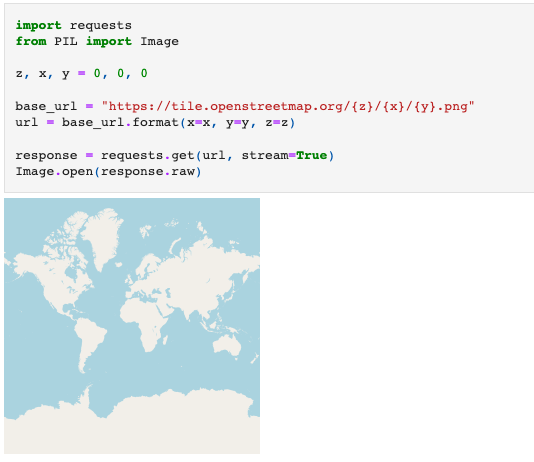
When you look at a map in a web browser, it might look like you’re looking at a single image, and when you pan around and zoom you’re just zooming further into that image. What’s actually happening is you’re looking at multiple images placed in a grid. What the web browser is doing is requesting images from an API and then arranging them in front of your eyes just in time as you pan and zoom. The cell below shows how to make a single request for an image.
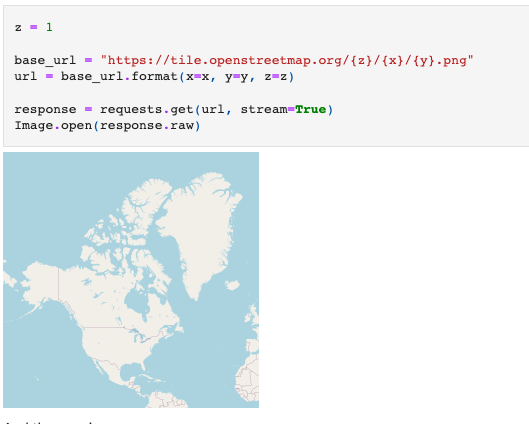
The image above shows the all of earth as a square image. It’s a 256 x 256 pixel image, so zooming into it will be quite pixelated. Notice how we’ve set z, x any y to each be 0. Since z is the zoom variable, to zoom in on that image, we increase z by 1.
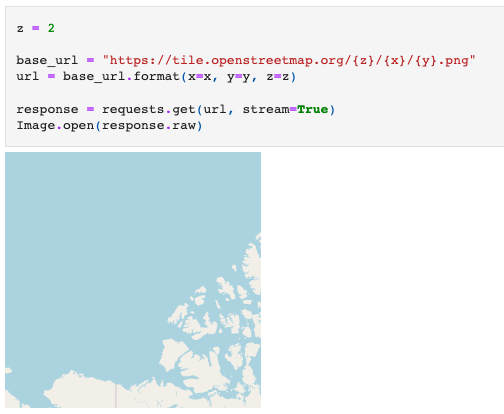
And then again…
As we see above, each time the zoom level increased, it changed the image returned. But each time it’s a 256 x 256 pixel image. Also notice that it’s always the north west quadrant of the first image we obtained.
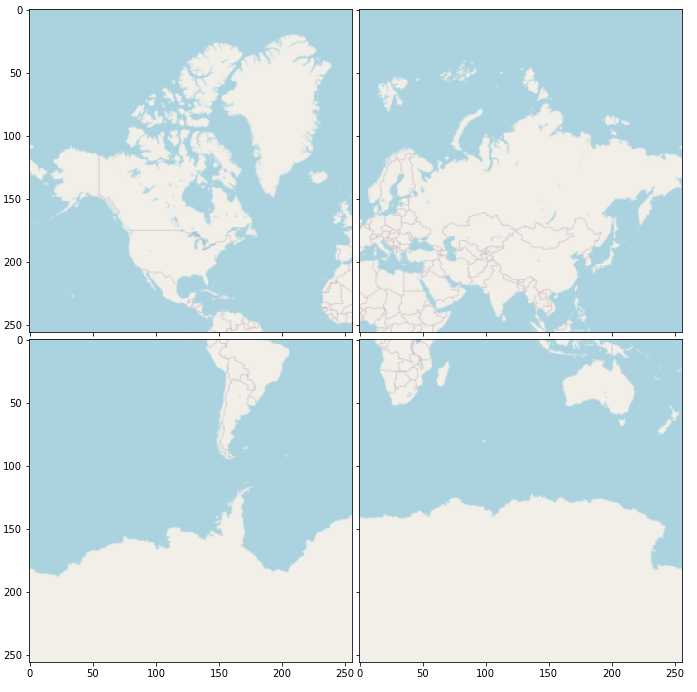
The structure of the WMTS is such that every time we increase the zoom level by 1, the image is split into 4 quadrants. What we’ve done so far is zoom in by changing the z parameter. By keeping the x and y as 0 and 0, we’re always looking at the most north western tile on earth. Increasing x and y brings us further east and south respectively.
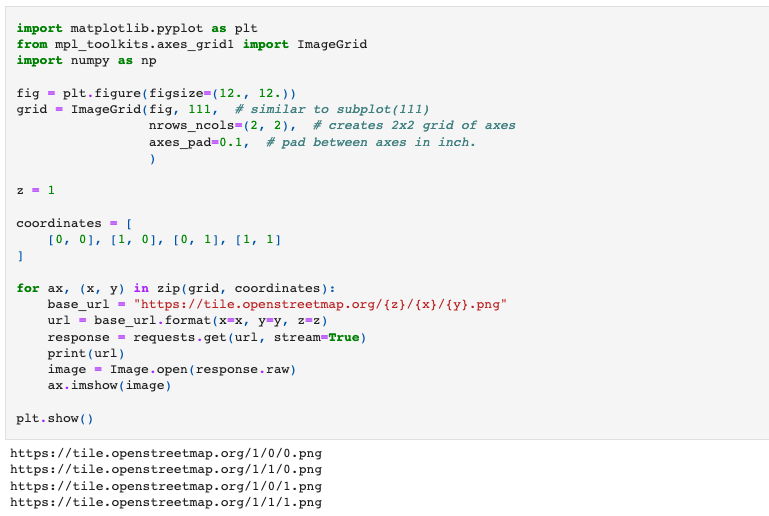
At zoom level 0, there are just 2 values for x and y: 0 and 1. So the coordinates for each tile are:
- 0, 0
- 0, 1
- 1, 1,
- 1, 0
The code below grabs each image for each coordinate and displays them in a grid. It uses a common plottling library called matplotlib to arrange the images.
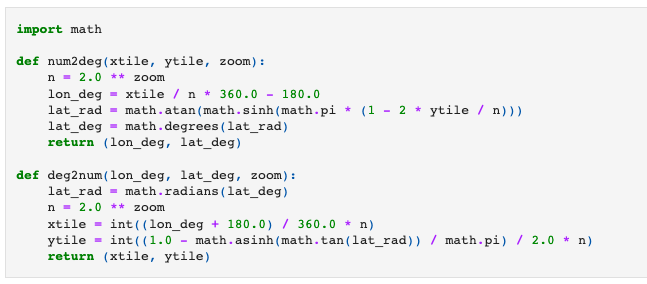
If you wanted to get an image at a particular location on earth for some zoom level, all you need is the x, y and zoom value. The cells below do the math on getting a tile coordinate from a latitude and longitude pair (deg2num) and then the opposite (num2deg).
Choosing a pair of longitude, latitude coordinates, we get the x and y coordinates for a particular tile at zoom level 14:
Now, we have a way to get a map tile at any point on earth, for any zoom level supported by that WMTS. Note many WMTS only support up to zoom 18, but for services providing ultra high image resolutions, zoom 21 and higher are typical.
The point of all of the above is just to demonstrate that web maps – typically using the WMTS – can be generated by simply making requests to some API by telling it the tile coordinates and then displaying the image.
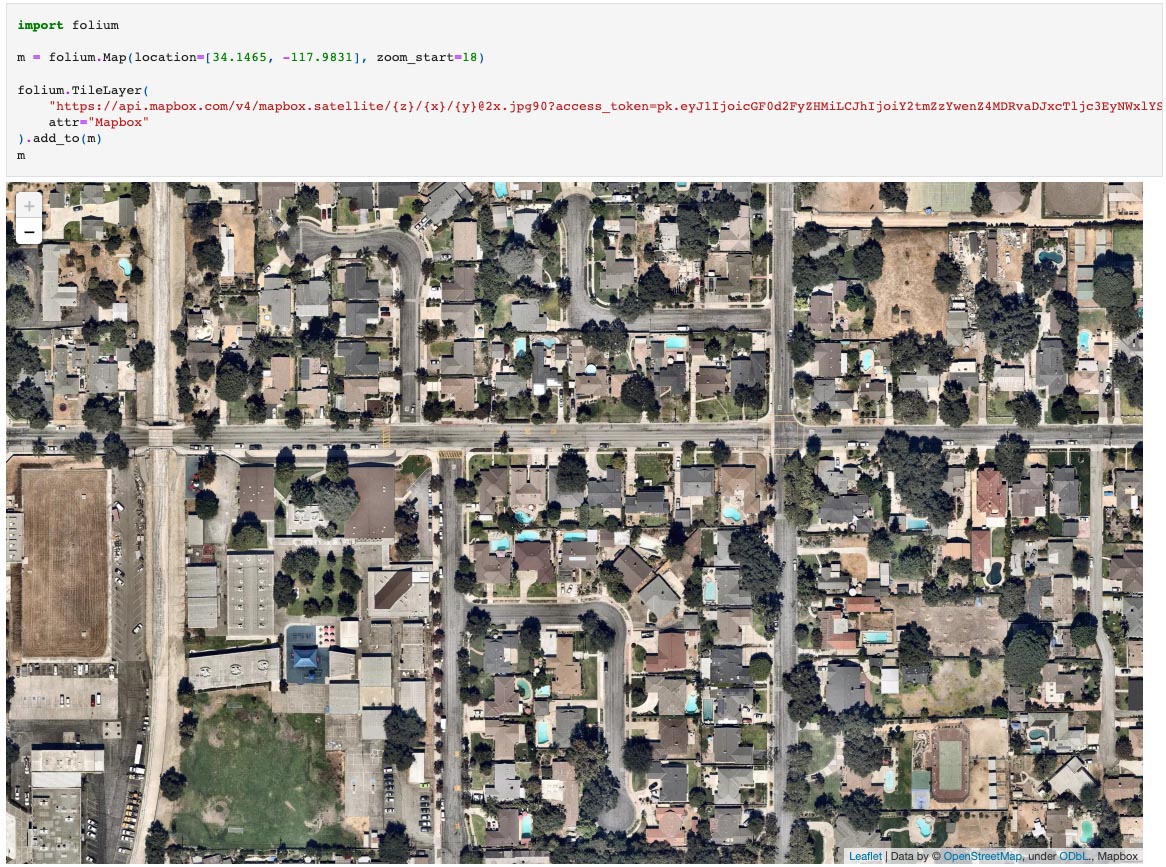
The cell below shows a more common view of a map tiles – as a collection of images that can be panned across and zoomed into. The URL named base_mapbox_satellite_url just gets passed to the TileLayer object. The TileLayer object keeps track of your interactions and then calculates are replaces the {x}, {y} and {z} for the x, y and z values to fill the map view.
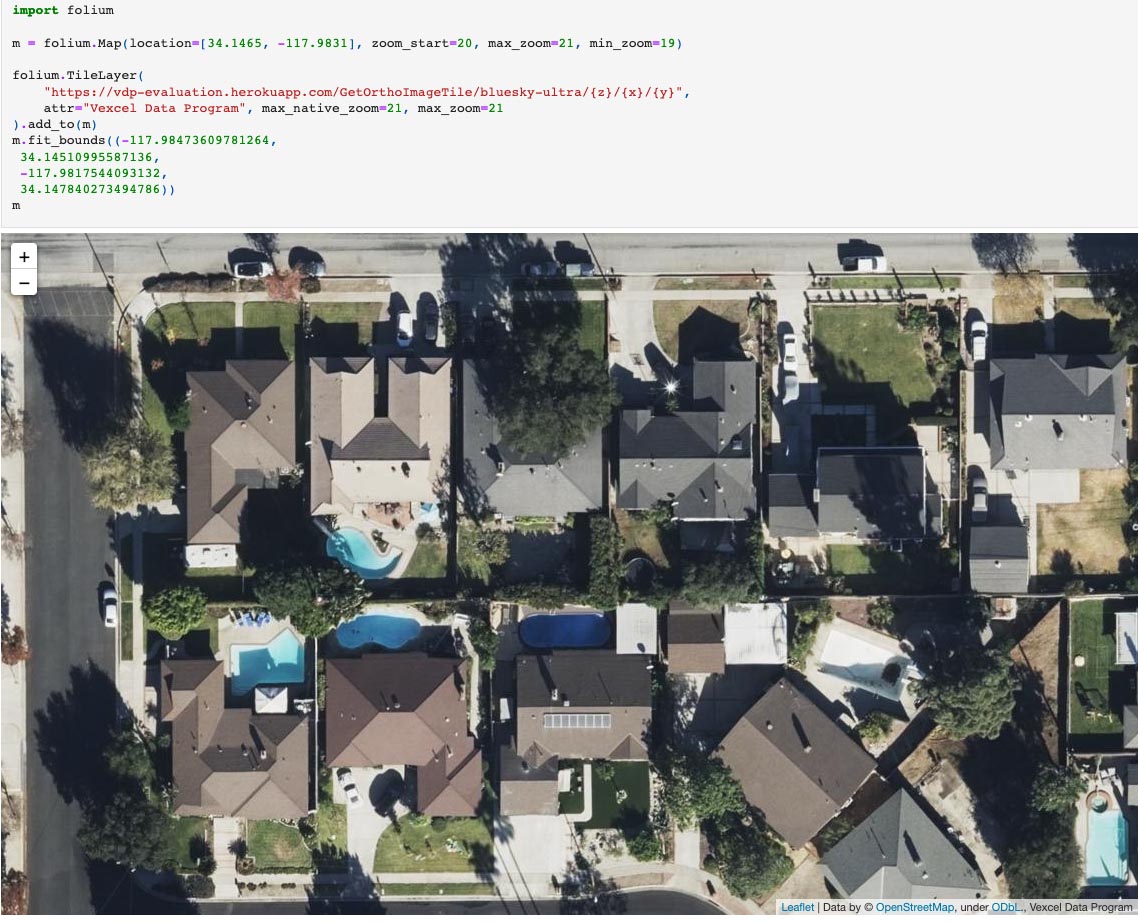
The cell below uses an API that can access just a small portion of the VDP library but is useful for demonstrating the capabilities of the API. As you can see, we’re using essentially the same code but just using a different URL. This is one of the great things about WMTS. It provides a consistent interface to grab remote sensing data like satellite or aerial imagery.
Part I was focused on showing you the basics of how to request and receive geospatial imagery. Understanding the concepts of how we map from a latitude and longitude, to a tile coordinate, to an image will make it easier to follow in Part II where we can detect shapes within satellite images and process those shapes back from pixel coordinates to geospatial features that can be viewed on a map. Look for Part II coming soon!





 GIC
GIC